
Compass Forex Strategy-Six MT4 Indicators based Strategy
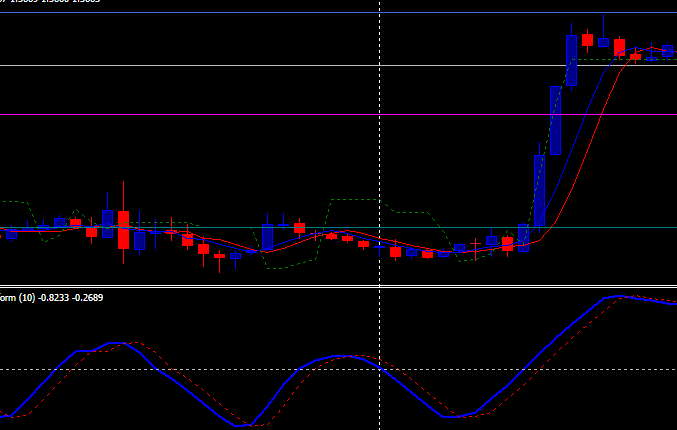
First, you will have to apply all the needed indicators & template on your trading chart. Those can be downloaded easily from the links given at the bottom of this page. Your chart for the Compass Strategy will appear like this:
Before explaining trading with Compass method, I would prefer to extend some degree of details about this system. My details will enable you to get a fair understanding on the components of this strategy.
My personal preference is 4H charts when it comes to Compass strategy. A time frame above or equivalent to 4 hours is compatible for Forex swing trading. It’s because here market noise is at minimum. The more a trader is able to filter market noise, better would be his rewards at the trading scene. The entire theory of consistent profitability (regarding Fx trading) revolves around this principle.
The Moving Average (MA) is an amazing tool here that helps to gauge slope of market trend as well as its strength. If both Moving Averages are looking upwards, you will know it signifies a bull market. But if the MAs point downwards, it is a bear market. But when they are just flat, it signifies sideways trend. MA’s separation angle shows the strength of trend. Wider is the gap in between two MAs, stronger is the trend.
You may enter trade on multiple currency pairs, provided you will be able to handle all of them together. You do not have to trade every signal on just one particular pair for consistent profits. In case, you find 2-3 signals on varied prime pairs, go for the one that shows optimum entry conditions. If it seems to be fit, you may integrate the candlestick patterns for improving profit.
Rules of Compass trading strategy:
Buy Rules in Compass Strategy:
Blue Moving Average > Red Moving Average (The blue one is above the red one)
Transform > Signal Line (Blue line comes above Red Line in separate indicator under price chart).When candlestick goes above Elders Safe Zone.
Sell Rules in Compass Strategy
Blue Moving Average < Red Moving Average (The blue one is under the red one)
Transform < Signal Line (Blue line comes under Red Line in separate indicator under price chart).When candlestick goes below Elders Safe Zone.
- compass-system.tpl
- Ehlers Fisher transform
- EldersSafeZone
- Pivots_Monthly.ex4
- Pivots_Weekly.ex4
- PivotsDaily v2.ex4
- SmoothCandle C v1.00
Questions about this strategy? Ask our community
Related Article: The Forex Strategy of Follow The Bouncing Pip
Download Compass Forex Strategy
DOWNLOAD STRATEGY