
The Strategy of Fratelli Intraday Trading
I do understand that some traders look for a Forex trading system that will be simple to comprehend as well as visually easy for the eye. They are surely not ready to shell out hours before the computer. Their main motto is to make some good pips and then go on with their life. In case, you happen to be intraday trader with a preference for short-term trades, look no further than this Forex trading system.
The Strategy of Fratelli Intraday Trading is compatible with AUD/USD, EUR/USD as well as EUR/JPY. We will be using MI5 time-frame here. You will start by applying the given template to chart to set the ball rolling. As soon as you will open template, the chart will appear as this:
Explaining Fratelli Forex Strategy:
You can see a gray zone here. Well, it refers to time zone which we will be trading. It’s actually the time-frame in between 07:00-16:30 (GMT). It will serve as the needed filter that can guard us from probable whipsaws and lean market hours.
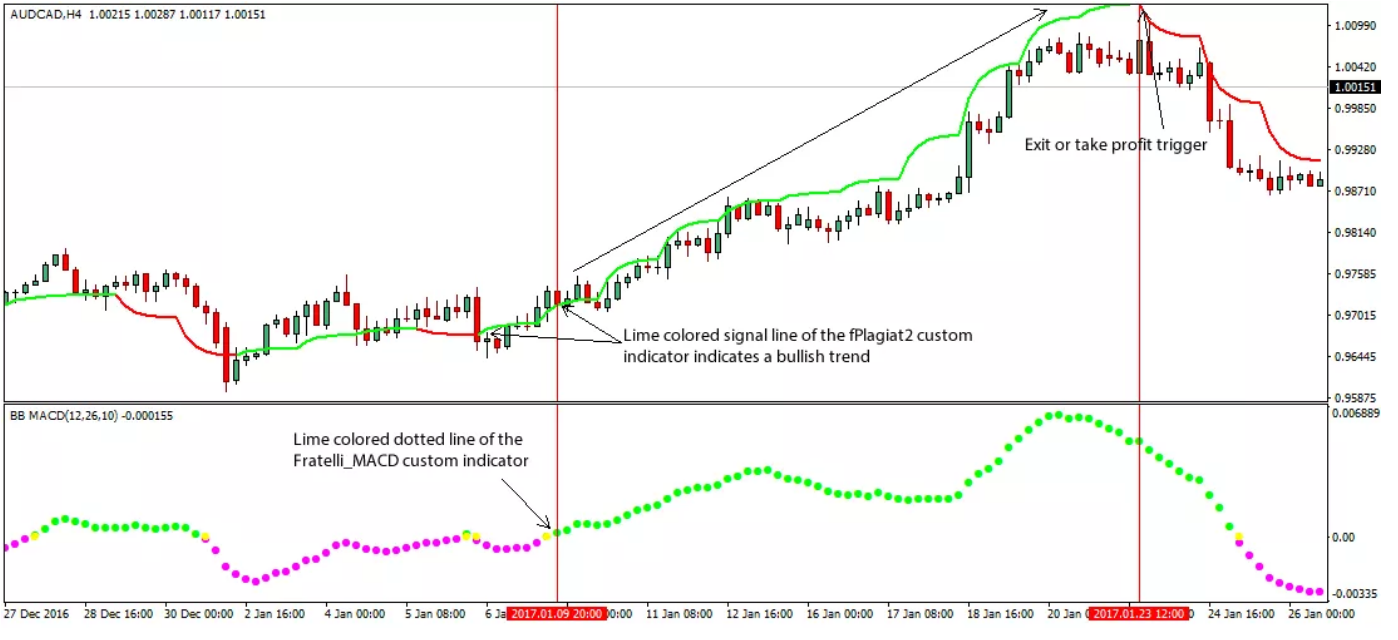
- Green candles signal bullish outlook while red candles symbolize bearish outlook.
- The line (white and black) depictsmoving average.
- BB MACD refers to last indicator which confirms a trader is on right track.
Trading rules of Fratelli Intraday
When to Buy
The candle shows green, the price bar seems to close above the moving average while BB MACD signal indicator creates yellow dot (+green dot)
When to sell
The candle shows red, the price bar seems to close below the moving average while BB MACD signal indicator creates yellow dot (+red dot)
Levels of Stop-loss & take profit:
EUR/USD:
The S/L will be 25 pips. The T/P will be 20 pips. If you see profit of 10 pips, move your S/L straight to -10 pips. If you see profit of 15 pips, move your S/L right to BE+1 pip.
AUD/USD:
The S/L will be 20 pips. The T/P will be 20 pips. If you see profit of 15 pips, move your S/L straight to BE+1 pip
EUR/JPY:
The S/L will be 20 pips. The T/P will be 20 pips. If you see profit of 15 pips, move your S/L straight to BE+1 pip
Have a look at the chart here for checking detailed sell & buy signals.
Box 1: At first you will see yellow dot, followed by red dot right on the BB MACD. The candle color will be red. Finally, when it will close below the MA line, you will be able to open short position (sell).
Box 2: It shows price has climbed above the MA line. The color of the candle has turned green. We have seen yellow dot (as well as green dot) right on the BB MACD indicator. And that was the perfect point to open long/buy position.
Box 3: Now, we do not usually trade in such situations. It’s because in this case we have received signal outside of trading zone.
Download Include:
fratelli-intraday-trading-system.tplFratelli_BB_MACD_V1
Fratelli_Line_MACD
Fratelli_MAIN_v1.3
MA in Color
Period_Converter_Opt
Questions about this strategy? Ask our community
Related Article: Gann Power System Forex Strategy
Download Fratelli Forex Strategy
DOWNLOAD STRATEGY