
RSISignal MetaTrader 4 Forex indicator has these features available for traders:
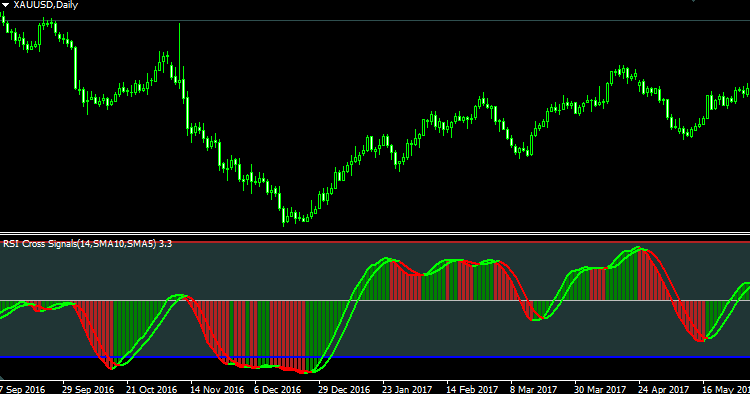
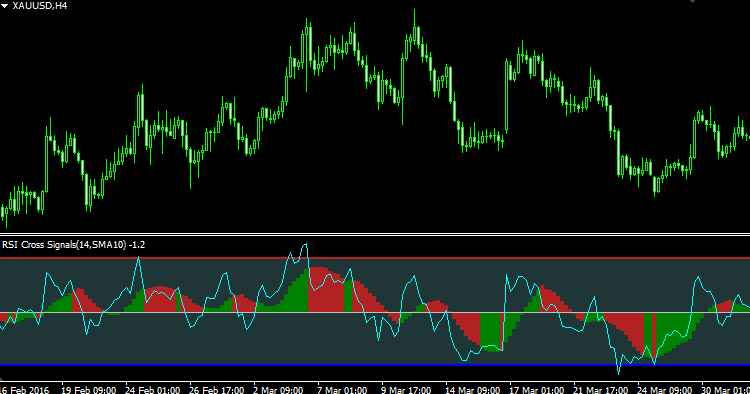
- Displays 3 RSI lines of different periods and the MA of the first RSI line (smoothed RSI).
- Two color MA lines.
- Four color histogram.
- Color filling between overbought and oversell levels (background).
- Users can turn off/on most of the features mentioned above.
- Displays the MA of the smoothed RSI. The crosses of smoothed RSI and its MA can be used as the signals.
- Displays histogram for RSI or its Moving Average.
- Colored level lines.
About RSI value of this indicator
- The RSI value of this indicator = original RSI value – 50
- The overbought/oversell level = original overbought/oversell level – 50
This is to make RSI changes around 0 (not 50), which is convenient to draw histograms.
Parameters
- RSI 1 Period – Period of RSI #1. If input is less than 2 or larger than 100, indicator will use default (14) instead.
- RSI 2 Period – Period of RSI #2. If input is less than 2 or larger than 100, indicator will use default (21) instead.
- RSI 3 Period – Period of RSI #3. If input is less than 2 or larger than 100, indicator will use default (7) instead.
- Overbought Level – Overbought level (70, or any other levels you need)
- Oversell Level – Oversell level (30, or any other levels you need)
- Smooth Period – Enter the MA period for smoothing RSI #1
- Smooth Method – Choose MA method for smoothing RSI #1
- MA Period – Period of second MA (MA of smoothed RSI #1)
- MA Method – Method of second MA
- Enable RSI 1 Line – Turn on/off RSI #1 line
- Enable RSI 2 Line – Turn on/off RSI #2 line
- Enable RSI 3 Line – Turn on/off RSI #3 line
- Enable Smoothed RSI 1 – Turn on/off Smoothed RSI #1 line
- Choose How to Draw Histogram – Three options to draw histograms:
- Draw Histogram for RSI 1:
- Draw Histogram for Smoothed RSI 1
- Disable Histogram
- Choose How to Change Histogram Color – Two options about how the histogram colors change:
- As Per Smoothed RSI #1 Direction
- As Per RSI #1 and Smoothed RSI #1
- Enable Background – If this option is enabled, indicator will draw histograms between Overbought level and Oversell level, as the background of “normal area”.
RSISignal MT4 Indicator – Download Instructions
In order to transform accumulated history data, you need to install a MetaTrader 4
RSISignal – it is a MetaTrader 4 indicator that allows you to detect several changes and dynamics in price that many traders can’t estimate or see without an indicator, which highlights its essence and usage.
Accordingly, traders can draw conclusions and make estimates about how the prices will change based on the information they have and then they can modify their strategy for better trading.
How To Install RSISignal MT4 indicator for MetaTrader 4.mq4?
Download indicator for MetaTrader 4.mq4Copy RSISignal indicator MT4 to Directory / experts / indicators /
Start or restart your Metatrader 4 Client
Select Chart and Timeframe where you want to test your mt4 indicator
Search “Custom Indicators” in your Navigator mostly left in your Metatrader 4 Client
Right click on RSISignal MT4 for MetaTrader 4.mq4
Attach to a chart
Modify settings or press ok
Indicator for MetaTrader 4.mq4 is available on your Chart
How to remove RSISignal MT4 Indicator for MetaTrader 4.mq4 from your Metatrader 4 Chart?
Select the Chart where is the Indicator running in your Metatrader 4 ClientRight click into the Chart
“Indicators list”
Select the Indicator and delete
Related Indicator: Hourly Pivot Points with Color Filling Indicator Forex MetaTrader 4
Download RSISignal MetaTrader 4 Forex IndicatorDOWNLOAD INDICATOR